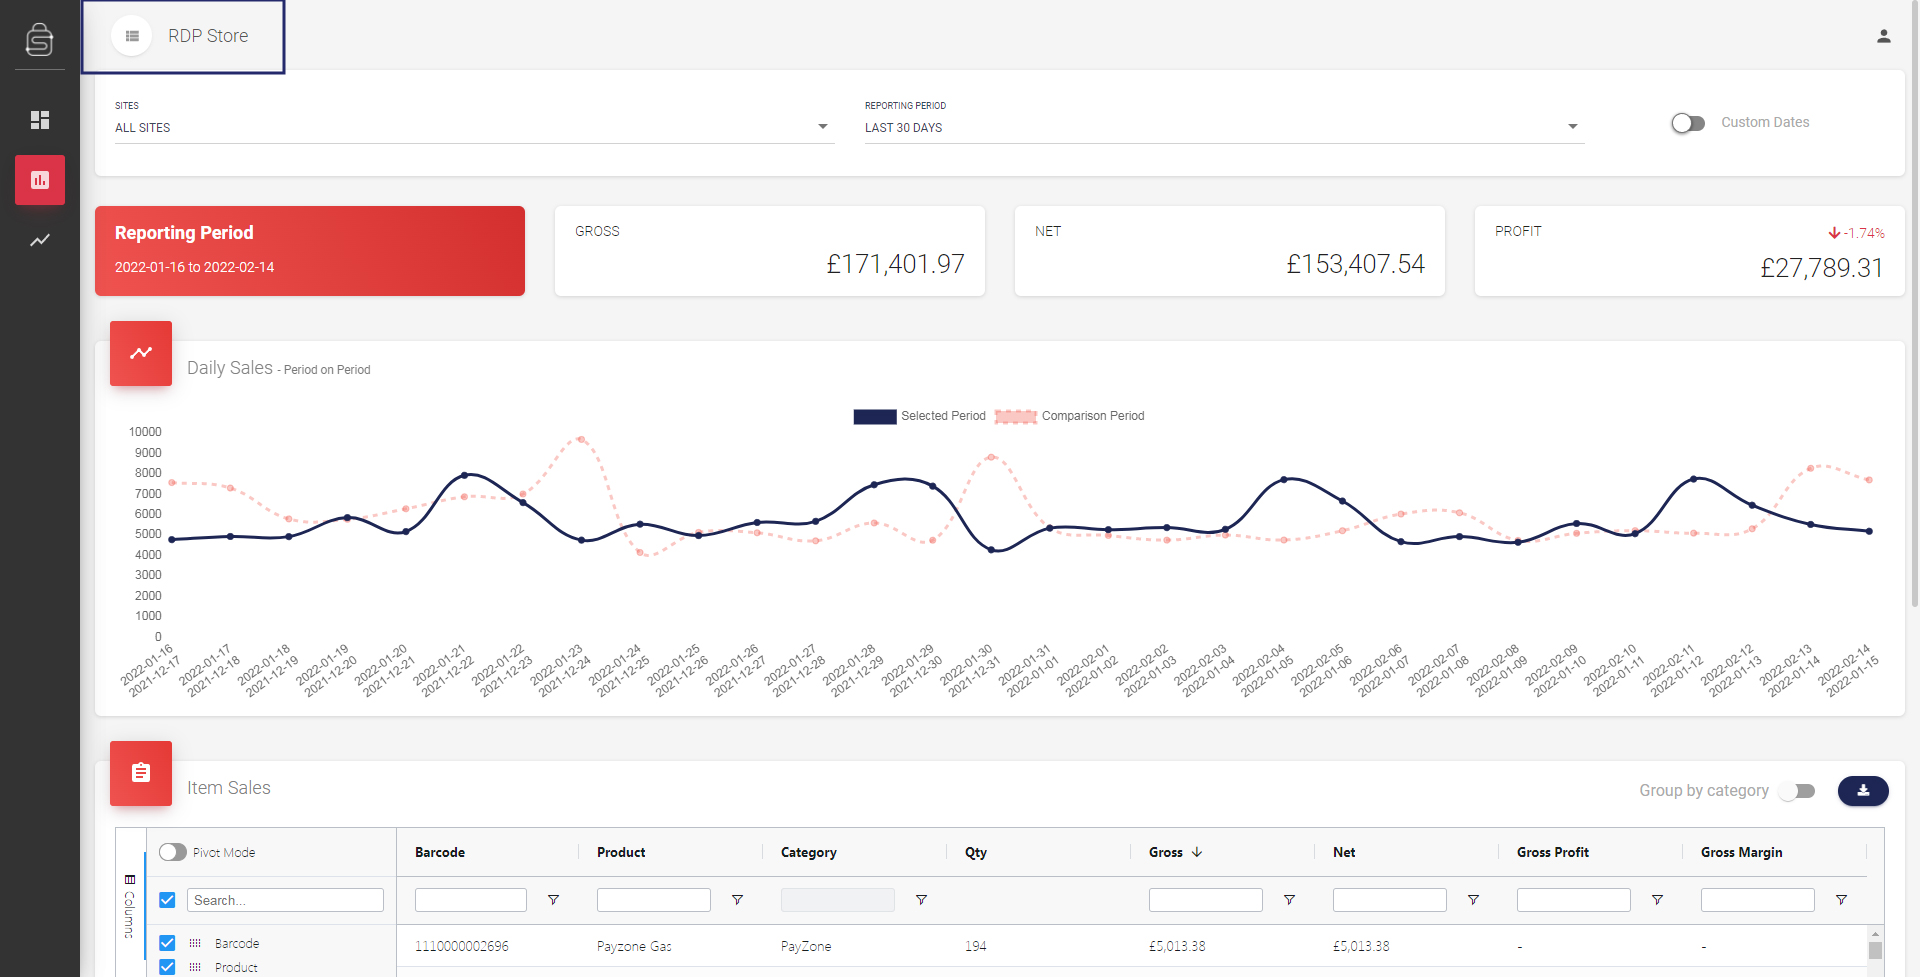
In the top left of the interface, you'll see your account name and a button with three horizontal lines. Clicking on this button will expand the left-hand-side navigation.
Getting to grips with the Reports Interface
The Reports interface you a real-time snapshot of your store's performance based on a wide variety of metrics that you can customise yourself. Here, we'll take you through the major sections of the interface and what they do.
You can access in-depth tutorials on each of the features using the links in each step.

In the next section, you can select whether you wish to display the data for all of your sites or a specific site. You can also assign a pre-defined date-range for your data-set or define your own.
Click here to view our help guide on setting up your own date-ranges and selecting sites.

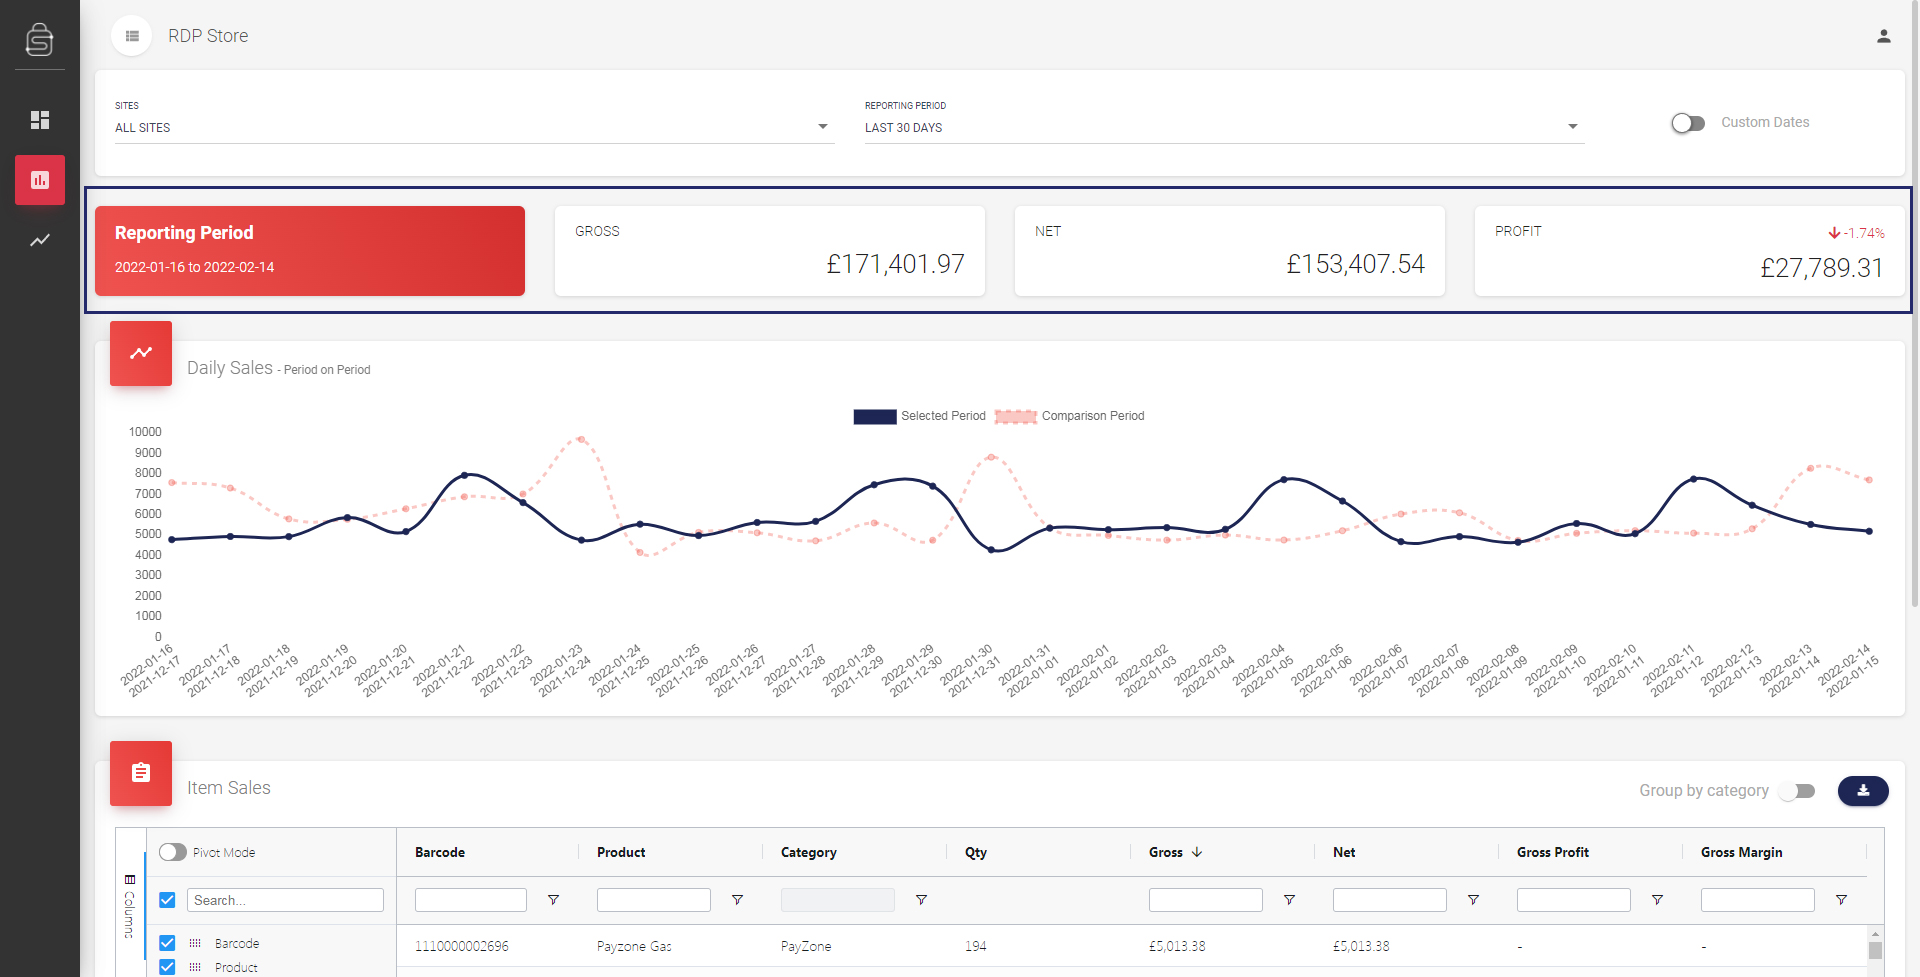
Next, you'll a breakdown of your financials over the reporting period that you selected above. You'll also see a profit comparison between the current selected period and the previous period, if data is available.
Click here to learn about how your Financial Summary is calculated.

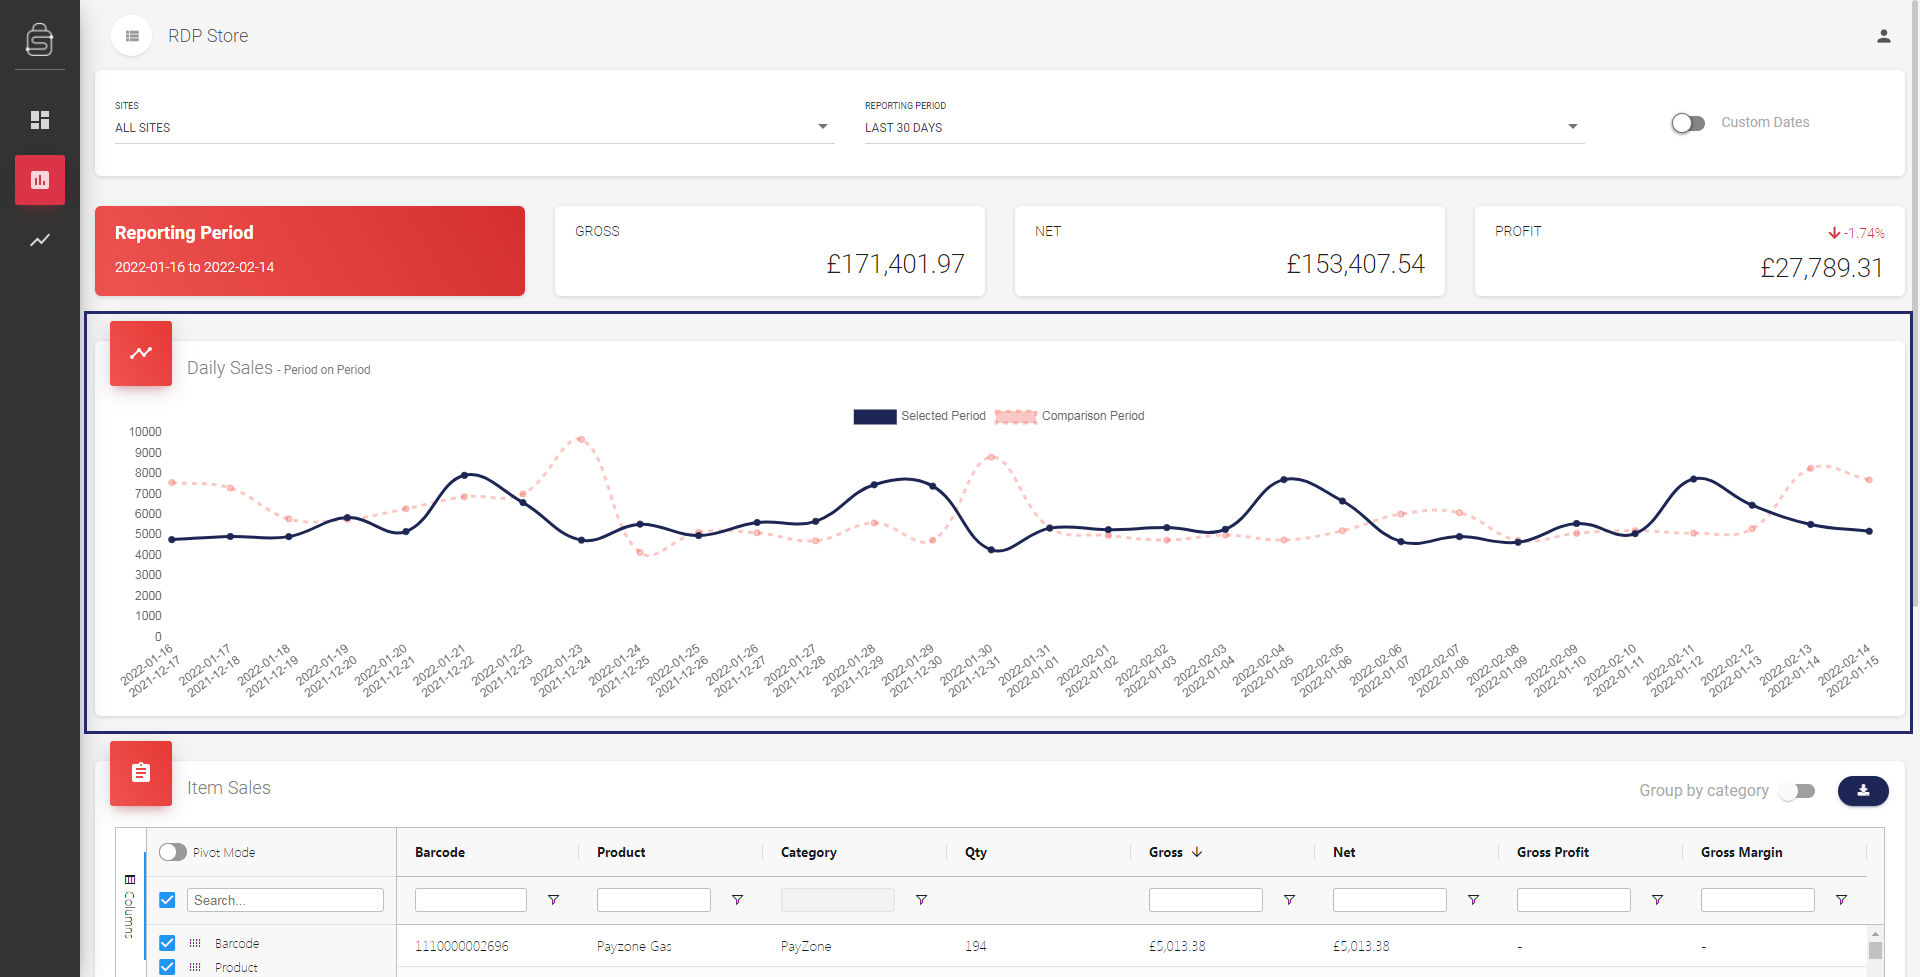
In the next section you'll see a graphical representation of the financial data above. The blue line is your daily sales across the period selected, the dashed red line is the same measurement but for the previous period.
Click here to learn more about how to dig deep into your Daily Sales chart.

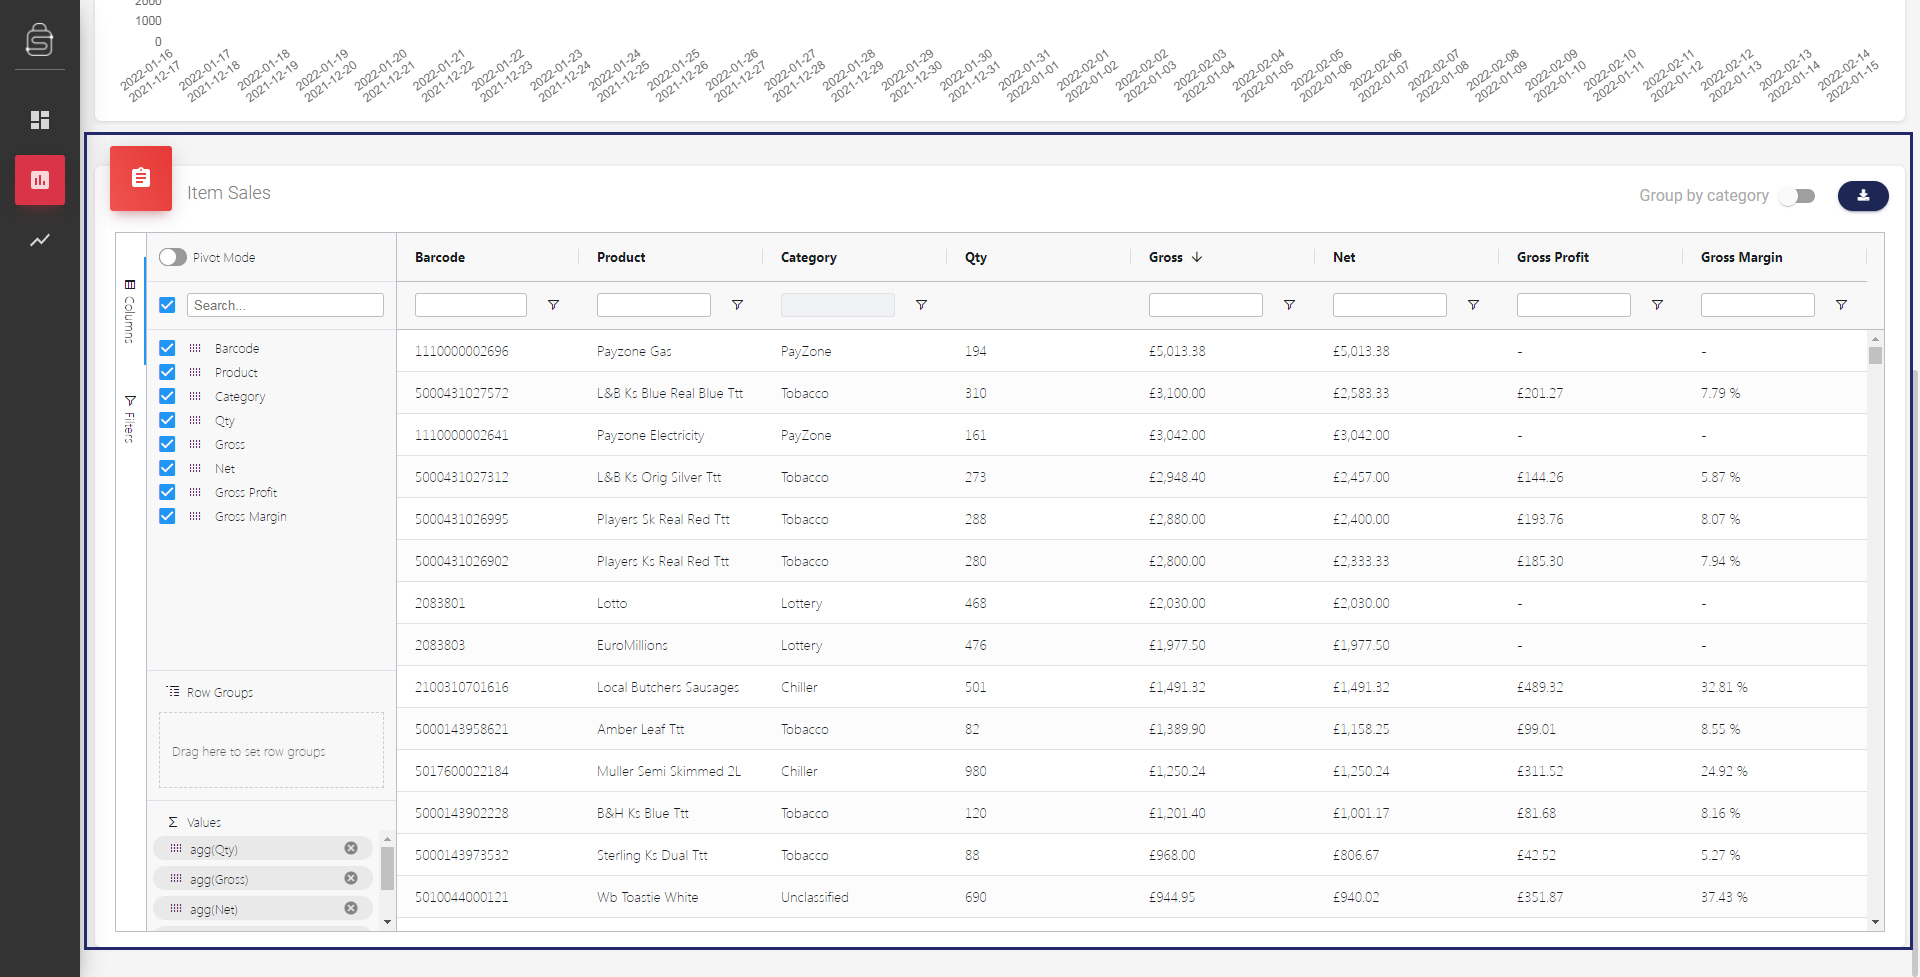
Finally, you'll see your Item Sales report. This gives you a highly customisable breakdown of your item sales, allowing you work with whole categories or individual products. The level of granularity is up to you.
Click here to learn about the wide range of features available in the Item Sales table and how to get the most out of it.
Contact our Technical Support team.
 |
95% of issues resolved on the phone |
 |
Speak to ShopMate experts every time |
 |
UK-Based Customer & Technical Support |
 |
365-day support as standard |
 01780 480 562
