Approaches to the Rising Dominance of Card Payments
Card payments in C-Stores
You don’t need us to point out that the number of transactions paid for by card has more than doubled over the last 4 years (from 22% to 46%.) The real question is: “What should retailers be doing about how they manage cash / card payments – if anything?”
The factors that retailers need to think about are:
- How much is it costing me to bank cash, and is there a better way for me to do this?
- Have I got the best card payment terms available, and how would I go about checking this / improving my terms with my card acquirer?
Some ATM cash machines are replenished by the retailer from their over-the-counter cash takings and this can mean fewer bank visits and cash processing charges and a better cash-flow. Other retailers find that offering cash-back is a suitable way to reduce the amount of bankable cash.
It is interesting to note that there is considerable difference in the way that consumers tend to pay for products from different categories, as shown in the table below. The Change column shows the increase in Card Sales, and consequently, the decrease in Cash Sales. We have left out 2020 and 2021, the “Covid years” from this table as they are not representative of day-to-day trading.
C-Store Categories
The biggest switch is in Alternative Smoking and Soft Drinks which might be due to the age of the consumer of these products or the nature of the way they are consumed – on the go.
The smallest switch is in Travelcards and Phonecards – possibly because these are products more frequently purchased by those with less spare cash each month, who put cash aside for these sorts of purchases.
News & Magazines and Lottery, have historically been a very high percentage of cash sales, have significantly increased the percentage of card sales. This suggests that even those reluctant to switch to card payments are now doing so.
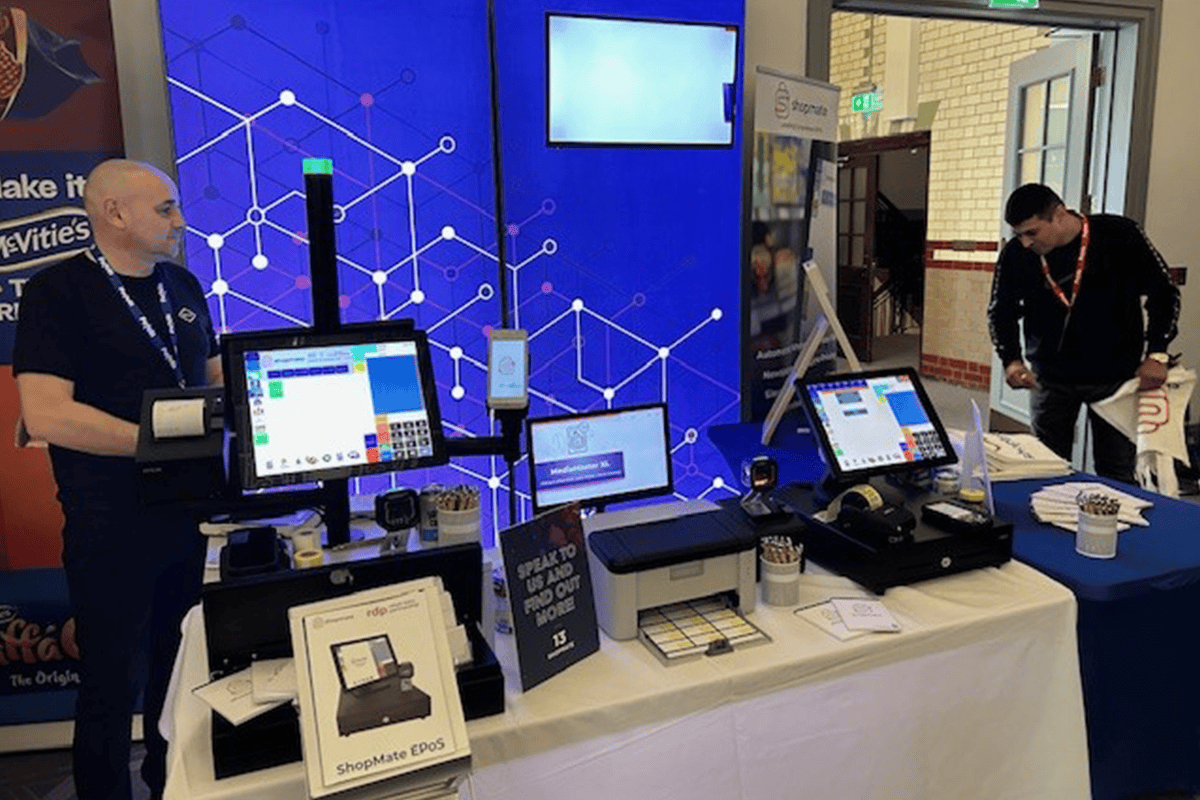
If you don’t already have integrated payment set up with your ShopMate system, you can speak to us about getting set up – there are lots of options to consider.
Cash and Card by Category
| Category | 2019 Card | 2019 Cash | 2022 Card | 2022 Cash | 2023 Card | 2023 Cash | Change | |
| Alcohol | 31.04% | 68.96% | 52.72% | 47.28% | 56.26% | 43.74% | 25.22% | |
| Alternative Smoking | 36.84% | 63.16% | 65.79% | 34.21% | 71.62% | 28.38% | 34.79% | |
| Chiller | 24.67% | 75.33% | 48.40% | 51.60% | 53.68% | 46.32% | 29.01% | |
| Confectionery | 20.68% | 79.32% | 43.77% | 56.23% | 49.36% | 50.64% | 28.68% | |
| Frozen | 27.65% | 72.35% | 50.77% | 49.23% | 56.00% | 44.00% | 28.36% | |
| Groceries | 24.87% | 75.13% | 49.08% | 50.92% | 53.80% | 46.20% | 28.93% | |
| Hardware | 26.91% | 73.09% | 44.51% | 55.49% | 43.87% | 56.13% | 16.96% | |
| Household | 25.74% | 74.26% | 49.03% | 50.97% | 53.77% | 46.23% | 28.03% | |
| Lottery | 12.53% | 87.47% | 27.90% | 72.10% | 30.86% | 69.14% | 18.32% | |
| News & Mags | 5.49% | 94.51% | 18.66% | 81.34% | 20.86% | 79.14% | 15.36% | |
| Pet | 23.89% | 76.11% | 46.18% | 53.82% | 50.64% | 49.36% | 26.75% | |
| Phonecards | 9.49% | 90.51% | 18.63% | 81.37% | 19.47% | 80.53% | 9.97% | |
| Snacks | 24.05% | 75.95% | 48.17% | 51.83% | 53.69% | 46.31% | 29.64% | |
| Soft Drinks | 21.00% | 79.00% | 45.29% | 54.71% | 51.62% | 48.38% | 30.63% | |
| Tobacco | 30.78% | 69.22% | 52.84% | 47.16% | 56.02% | 43.98% | 25.23% | |
| Travel Card | 10.74% | 89.26% | 21.28% | 78.72% | 21.18% | 78.82% | 10.45% | |
| Average | 22.27% | 77.73% | 42.69% | 57.31% | 46.42% | 53.58% |


