Low and No alcohol products are seen more frequently in stores– they appeal to drivers, people on weight loss diets, the health conscious and those who are pregnant or allergic, as well as to people who simply wish to moderate their drinking. Alcohol free has come a long way in terms of taste – Guinness 0% has been in development for ten years according to a recent Channel 4 documentary.
We’ve compared total sales of alcohol categories with the sales of low and no alcohol versions – note there are two scales on the following tables so we can compare the curves, the scale on the right hand side relates to low & no alcohol sales , the scale on the left relates to all sales in that category.
Beer
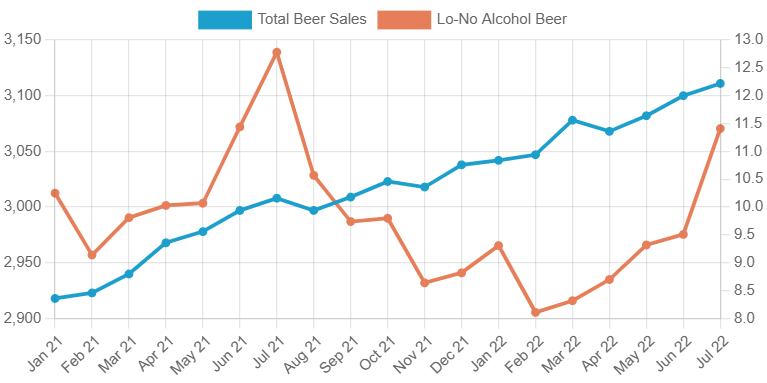
Alcohol Free Beer has the largest share of its parent category, accounting for 0.6% of Total Beer sales. It also has the largest number of active barcodes, with 94 selling in this year to date. Beer accounts for 36.3% of total alcohol sales but makes up 74% of Low/No Alcohol sales.
Average sales per store for total Beer sales have steadily increased over the last 18 months. For Low/No Alcohol Beer, rate of sale was fairly stable during 2021, with a peak in July which might correlate with more parties in the summer with drivers needing to take precautions.
Average Sales per Store - Beer and Low/No Beer
Average Sales per Store - Cider and Low/No Cider
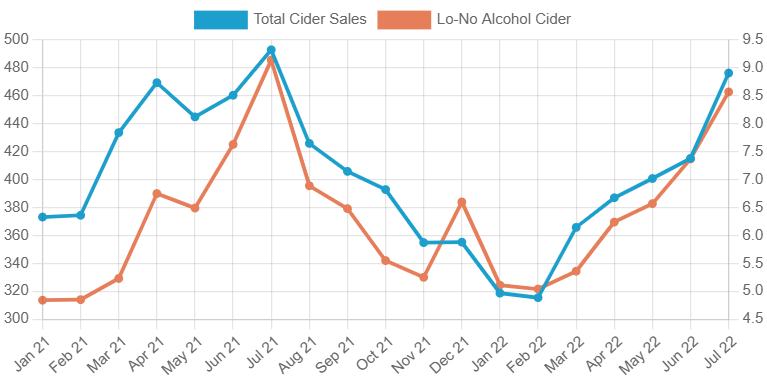
Cider
Despite only selling 16 different barcodes year to date, Alcohol Free Cider has the second highest share. Cider also has a larger share of Low/No Alcohol compared to total sales. Average sales for both total cider and low/no alcohol cider follow the same trend with a small additional rise over the festive period for Low/No alcoholic cider.
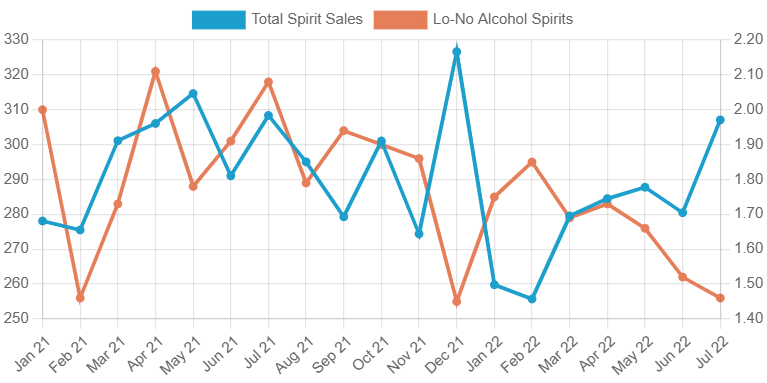
Spirits
Alcohol Free Spirits have a low share of Total Spirits with only 8 active barcodes seen this year, 7 of which are Gin. Average sales for total spirits have remained fairly stable over the last 18 months, with the usual Christmas peak. Average sales for Low/No Alcohol spirits have been decreasing with a significant dip in sales last Christmas. The dip in December suggests that we prefer an alcoholic tipple at Christmas – perhaps because we are more likely to stay in one place after a drink and not drive home afterwards. There are also spirits which are typically bought at Christmas which don’t have a 0% alternative which may be why we don’t see the same trend in Beer or Cider.
Average Sales per Store - Spirits and Low/No Spirits
Average Sales per Store - Wine and Low/No Wine
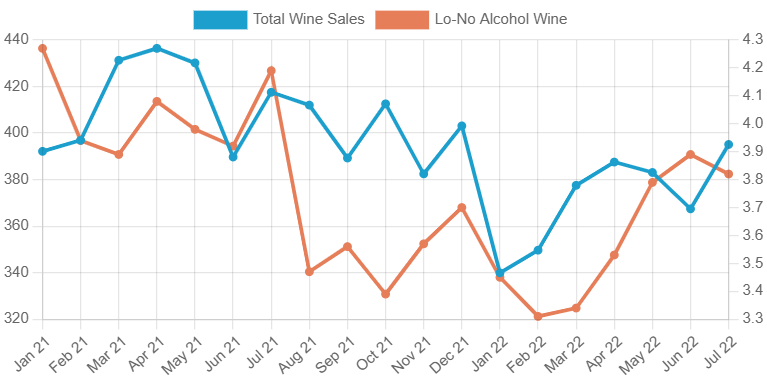
RTD and Wine
There are 10 active Alcohol Free RTDs but they sell in very few of our stores. Average sales for both total wine and low/no alcohol wine follow a similar trend. Rate of sale this year to date is lower than seen in 2021 – perhaps the effect of returning to normal following lockdown. The July peak has appeared again this year for wines but is slightly lower than in 2021.
We will continue to monitor “Low & No” and keep you updated with our findings. For now, stores with the space should stock Low/No Beer and Cider to ensure they have a well-rounded range.